From President Garvey’s presentation at May 1, 2018 Faculty Luncheon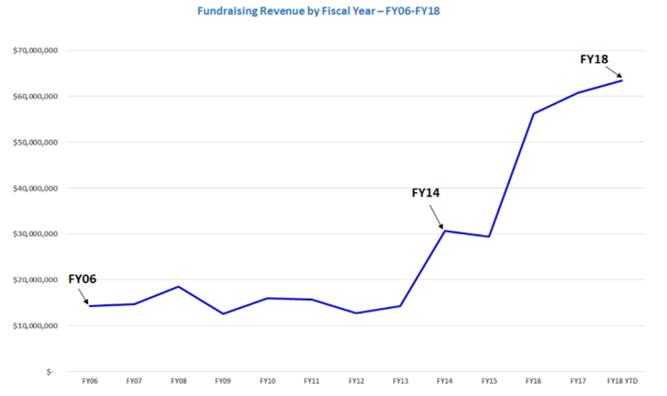
IRS 990, IPEDS, and CUA Annual Report Data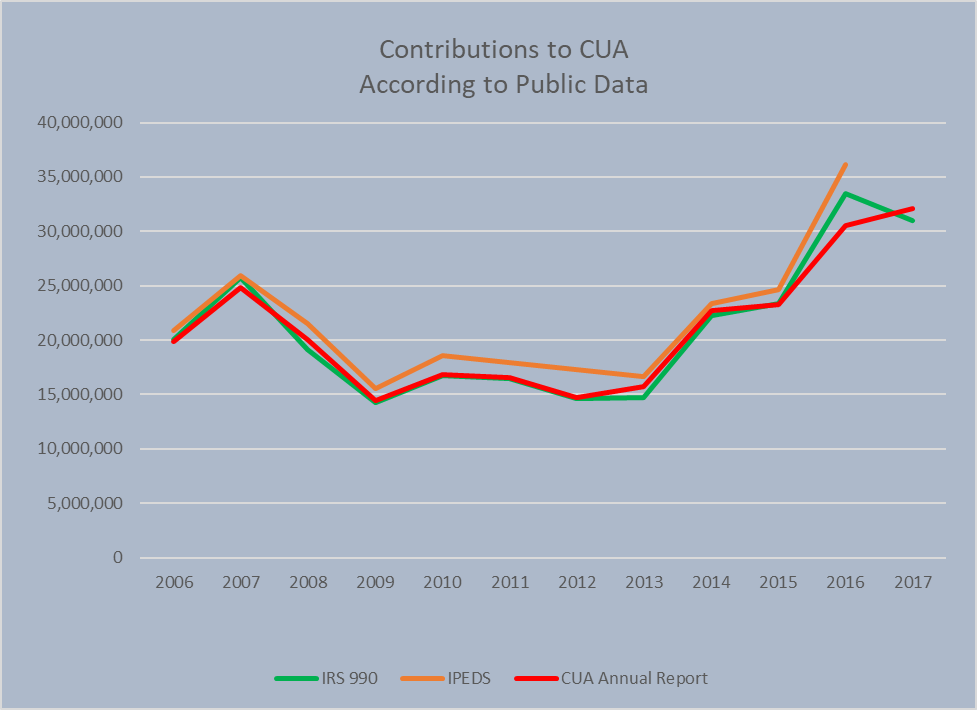
Faculty Luncheon Figures vs Publicly Available Data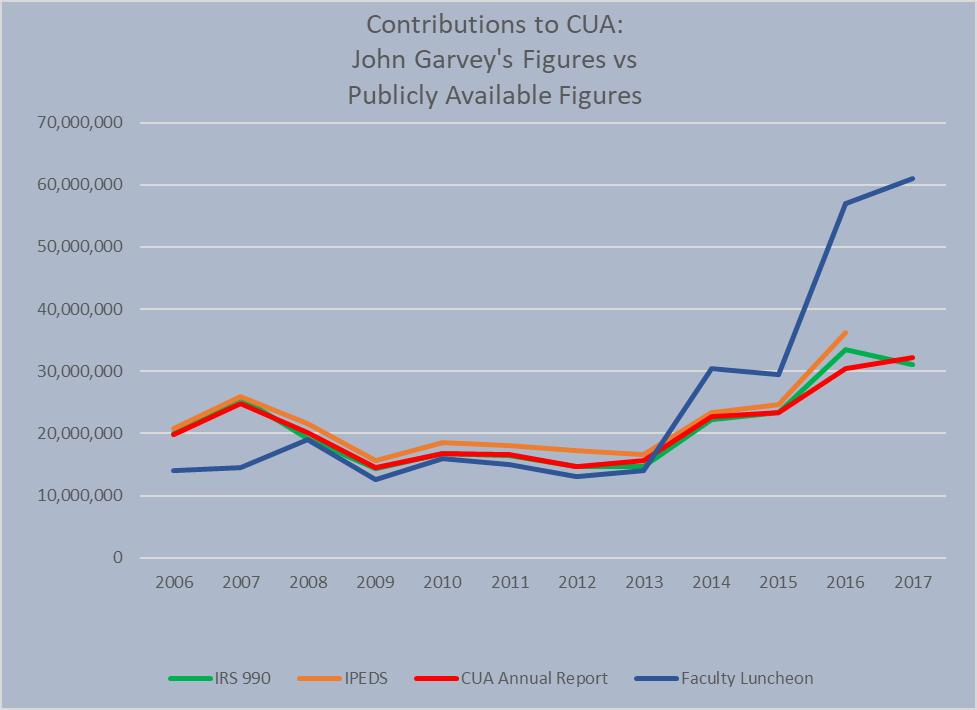
Why is there such a significant discrepancy between the President’s figures for 2014-2017 and those we have reported to the IRS, to the USDOE, and in our own annual reports? There is nothing in his remarks that would explain the discrepancy. On the contrary, as President Garvey explained, there is little wiggle room in the reporting of contributions: “Gifts are counted in a campaign in the year they are pledged.”
Does President Garvey’s graph include capital campaign contributions? If that is the case, one might wonder whether that really is a good idea. Shouldn’t we distinguish our usual annual efforts from a capital campaign in order to preserve the ability to compare apples to apples? If the graph folds in the capital campaign, is it really fair to compare the combined results to the results prior to the capital campaign?
Why are the President’s figures for 2006 and 2007 so far below those publicly reported? Referring to the graph the President said, “As you can see, we were fluctuating in the $12M-$18M range when I arrived in FY11.” Actually, they reached $25M in the period he cites. One can only hope that there is some honest explanation for the significant discrepancy. What data sources was the President using that showed such reduced fundraising success for 2006-2007?